Demo
Simulation of traffic in Querétaro city
Follow this link to visualize a dashboard written with the Dash framework and Dash Sylvereye. The dashboard displays a SUMO simulation of vehicle traffic happening at the center of Quéretaro city.
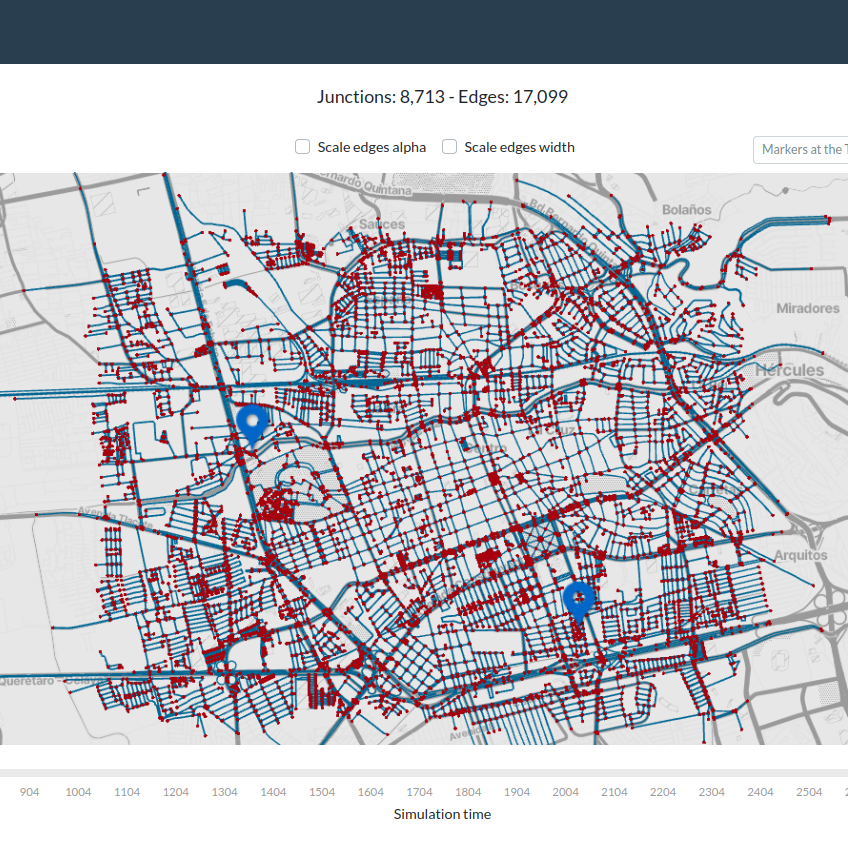
The dashboard prominently features a Dash Sylvereye visualization. Users can choose visible layers via a checklist, and display markers either at the centers of the busiest edges or on the slowest vehicles based on their selection. They can also adjust visual aspects of edges like transparency and width relative to vehicle count through another checklist. A slider on the dashboard allows users to select and display a specific simulation time.
Details about the simulation data and the internals of the dashboard can be found at Dash Sylvereye's arXiv paper.